
This is a star plot that represents selected peak ratios ranging around gas chromatographic analysis of oil samples.

 This is a similarity matrix that is representing the similarity of the Bible in English.
 This is an example of a stem and leaf plot. It doesnt tell me what it is representing, but it shows what a stem and leaf plot is composed of and how it is set up.
 This is a histogram that i got from an earth observatory website. It lists quite a few data sets. It shows brightness and value count in reference to chlorophyll, fluorescence, and sea surface temperature.
 This is a climograph that is comparing the temperatur versus precipitation of Schefferville. It is using the line to connect the precipitations and the bars to represnt the temperature intervals throughout the months of a year. This way it can represent an overall average climate for the year.
 This is a scatterplot showing President Bush's predicted votes categorized by state vbs. the actual vote share. It uses percentages as increments for the vote share relationships. It also correlates with marriage and fertility statistics which are showed in red.
 This is a Lorenz Curve that is representing the relationship between cumulative population vs. cumulative household income in the years 2002/2003.
 This is a bilateral graph because it is representing two different types of data in the form of a bar graph. In this graph, it is showing the ratings of mental health categorized within another set of data, which is political party ID. It also lists the quality of mental health between margins of excellent, good, and poor.
 This is an unstandardized choropleth map showing populations in Northern New England that are under low income circumstances in 1999. It represnts this with more detailed areas and shading.
 This is a univariate choropleth map because it is only displaying one set of information. In this case, the map is showing the percentage if individuals within different areas of the United States. It is representing the data sets with different shades and colors.
 This is a bivariate choropleth map. It shows different sets of information using colors and shades. This map is illustrating different climate zones in Australia. It also shows the different biomes that these climates categorize into.


 This is a map showing watershed boundaries of the Lost Creek stream in eastern Utah. It is also showing some isolines around different poarts of the surrounding cities. http://www.emrl.byu.edu/gsda/lost_creek/drg_planview_watershed.jpg
 This is an isohyet map, showing the amount of rainfall in different areas. It is showing the areas that share common amounts of rainfall with the circles. It doesnt say what area of the world this is showing.
 This is an isobar chart for Europe showing the air pressure and the places that have common air pressure. It is also showing cold fronts, which are the darker lines with the triangles on them and the warm fronts which are the darker lines with the half circles on them. It also shows low pressure and high pressure cyclones. http://www.uni-koeln.de/math-nat-fak/geomet/meteo/winfos/ukmetof/tnlast_24.gif
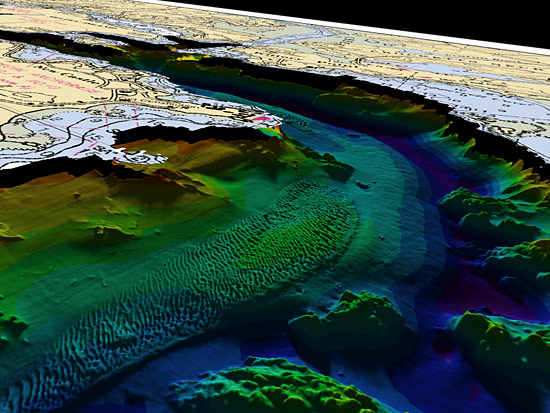


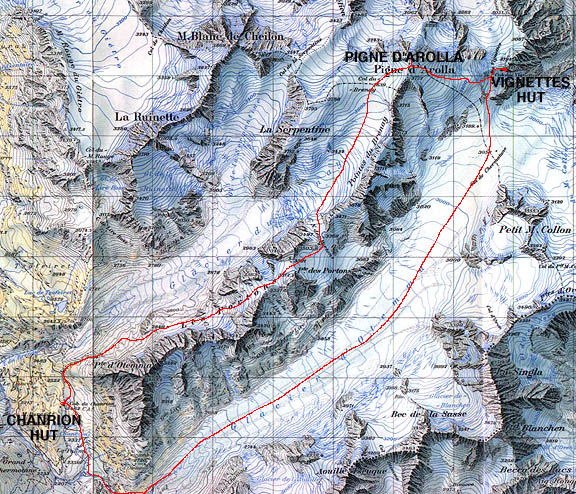
 Choropleth Map: map in which areas are shaded or patterned in proportion to the measurement of the statistical variable being displayed on the map.
 This is a propaganda map showing the rat representing Japan and it is approaching an "Army Navy Civilian." This map is trying to portray the power of Alaska Army Navy over Japan.http://upload.wikimedia.org/wikipedia/commons/6/67/Alaskadeathtrapa.jpg
 Hypsometric Map: a map giving elevations by contours, or sometimes by means of shading, batching, or tinting.
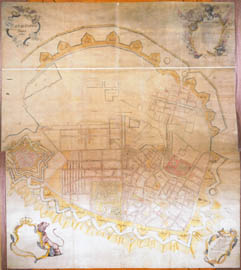

 Planimetric Map: A map on any scale showing only the relationships of surface features(locations and distances) on a horizontal plane, with no indications of vertical relief.
 Mental Map: A map which represents the perception and knowledge a person has of an area or idea.
