skip to main
|
skip to sidebar
Maps
Friday, August 8, 2008
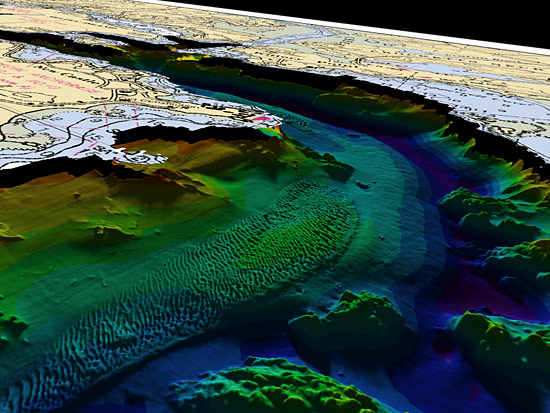
LIDAR
LIDAR instruments were used to map the rising sea level and the moving shorelines. This image is helping scientists study sediment movement and geological framework.
http://bunchofmaps.blogspot.com/2008/08/lidar.html
No comments:
Post a Comment
Newer Post
Older Post
Home
Subscribe to:
Post Comments (Atom)
Blog Archive
▼
2008
(50)
▼
August
(39)
Star Plot
Correlation Matrix
Similarity Matrix
Stem and Leaf Plot
Box Plot
Histogram
Parrallel Coordinate Graph
Triangular Plot
Windrose
Climograph
Population Profile
Scatterplot
Index Value Plot
Lorenz curve
Bilateral Graph
Nominal area choropleth map
Unstandardized Choropleth Map
Standardized Choropleth Map
Univariate choropleth map
Bivariate Choropleth Map
Unclassed choropleth map
Classed Choropleth Map
DOQQ
DEM
DLG
DRG
Isopleth
Isohyet
Isotach
Isobar
LIDAR
Doppler Radar
Black and White Aerial Photograph
Infrared Aerial Photograph
Cartographic Animation
Statistical Map
Cartogram
Flow Map
Isoline Map
►
June
(5)
►
May
(6)
About Me
Nicolle
View my complete profile
No comments:
Post a Comment